
DS_Post_Fac
DS_Post_Fac_T2
DS_Post_Sup
DS_Pre_Fac
DS_Pre_Sup
DS_Simp
Variations
Direction Selective Simple Cell
Priebe NJ, Ferster D (2005) Direction selectivity of excitation and inhibition in simple cells of the cat primary visual cortex. Neuron 45:133--145.
Troyer TW, Krukowski AE, Priebe NJ, Miller KD (1998) Contrast-invariant orientation tuning in cat visual cortex: thalamocortical input tuning and correlation-based intracortical connectivity. J Neurosci 18:5908--5927.
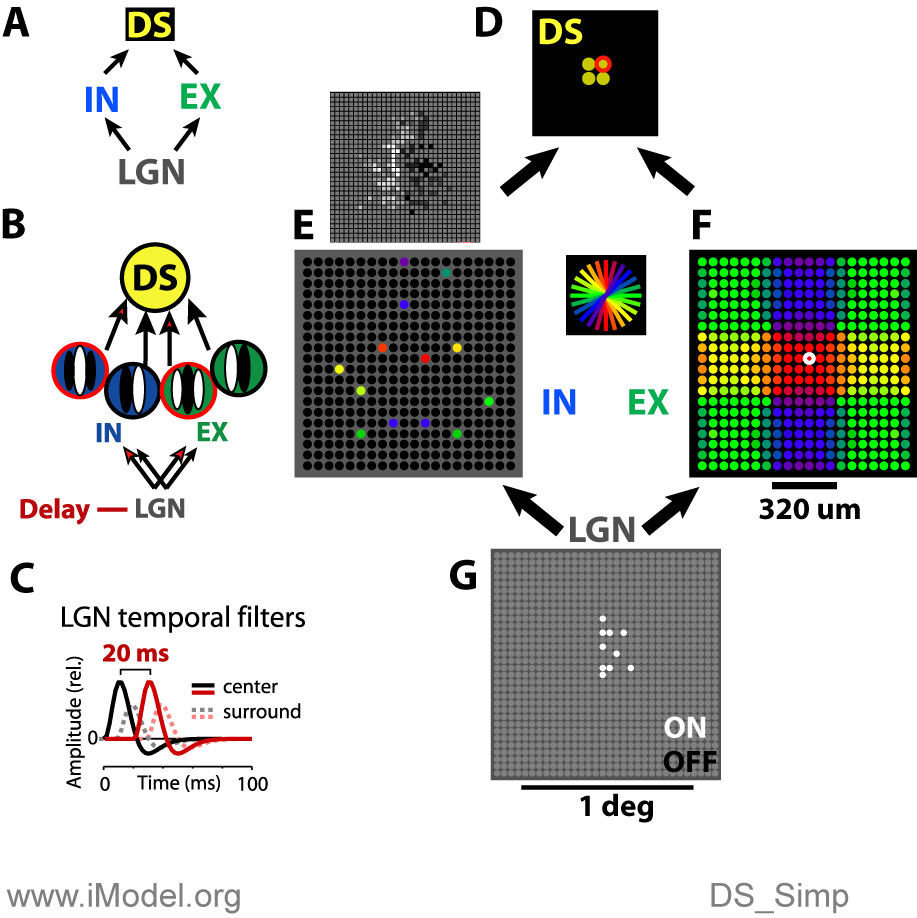
(B) Each DS cell in (D) receives excitatory and inhibitory conductances from EX and IN inputs. One set of these EX and IN inputs (EX_D and IN_D, circled in red) receive LGN inputs (red arrows) driven by an LGN population, LGN_D, that incorporates an added delay in spike time latency of 20 ms. The inputs to the DS cells are chosen such that the RFs of the EX and IN units fit Gabor templates satisfying two conditions: 1) Delayed and nondelayed EX/IN inputs fit templates that are approximately in quadrature (90 deg phase shift); and 2) Both delayed and nondelayed EX and IN inputs are spatially anti-phase.
(C) The difference in time delay between the two LGN populations is achieved by shifting the temporal filter for units in one population (LGN_D) by 20 ms (red plot) relative to the other LGN population (black plot).
(D) A population of four V1 DS simple cells.
(E) Within a 20,20,1 (x,y,z) lattice of V1 inhibitory simple cells (IN), cells that are presynaptic to the white-circled cell in (D) are shown in color. Colors indicate preferred orientation (see orientation key between panels E and F). The approximate spatial RF for all of these combined IN units is shown in the top plot.
(F) The 20,20,1 lattice of V1 excitatory simple cells (EX) is shown where color indicates orientation (see orientation key). The white-circled cell gets LGN inputs as marked in (G). This cell contributes input to the DS cell in (D, red-circle).
(G) The LGN lattice is 32,32,2, where the two z-layers represent ON and OFF cells. The 20,20,1 lattices of EX and IN cells align to the central 12,12 sub-grid of cells in the LGN, in terms of their RF centers within the field of view.